
Habitat Walkthrough
Habitat monitors applications, operating system and hardware for performance, availability and performance level. It's design goals are to be of modest size, flexible and ubiquitous.
Habitat can be run as a stand-alone monitor, a peer in a set of machines or as an agent-oriented collector feeding the System Garden central repository. As a visualisation tool, it can read data from itself, its peers, the central repository or other collection systems. Its easy to extend, using a simple data format to allow many different data formats to be read or the integration of data collection probes.
The Browser
MyHabitat, is a 'fat' graphical client used to view the data collected by Habitat locally or from other network repositories.
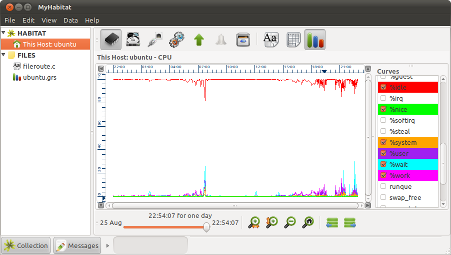
The screen shot to the right is a typical start up view, showing a graph of the most recent CPU consumption on the local machine, generally over the last day. If that information is not available, MyHabitat will do its best to display some useful local information from what it does have.
To the left of the graph in the screen shot, is a list containing data sources, typically hosts or files. Clicking visualisation choices and by clicking on parts of the tree, different information is displayed in the right hand pane. Above both panes is the menu bar which gives some common features, such as help and exit (File->Exit).
Graphs
In a graph pane, there is a set of buttons to the right that select which attributes (or curves) are plotted. The default will depend on the information that is found, and can be removed by un-clicking the colour coded buttons.
If there is enough data, a single graph could display a whole year of data in a single view. Whilst this may be good for displaying underlying trends, the detail for a particular week or day may be lost.
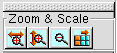
The solution is to zoom into a particular part of the graph by using the magnifying glass buttons above the curve list on the right or by left-dragging the mouse over the interesting area of the graph and clicking the left button inside it. Zoom out by using the zoom-out button or by right clicking the mouse.
Using the zoom feature, it is possible to zoom to a single week, day, hour or beyond from an initial high level view. Once at a convenient scale, pan around the graph using the scroll bars or the middle mouse button to drag the graph around.
If you are interested in the sub set of data that you can see, you can export or send it using a menu option (Data->Save Viewed... or Data->Send to Application...). It is sent or stored as a comma or tab separated file and can be imported into your favorite spread sheet or presentation package. Some packages are integrated enough to have menu options of their own.
Also possible is the ability to change the gradient or offsets of any of the displayed curves with the 'more control' button. Used with caution, this can help show the correlation of two different attributes on the same graph. For example, I/O rate in bytes per second (typically in the order of many thousand) compared with CPU (in the order of tens).
Choices
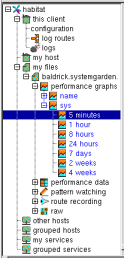
The choice tree in the left hand pane controls the visualisation in the right. A top level grouping helps identify the different data sources, such as my files, where data has been stored in files or my hosts where data is obtained from the network. Other top level choices allow administrators to centrally group machines or services together on behalf of all users. All of these methods allow for dynamic updating of data, albeit with different characteristics.
Local data is held under the my host label, under which will be the visualisations and time periods possible on the local machine. Other machines running Habitat can be viewed by selecting File->Hosts... and typing the host name. If the Clockwork agent of Habitat is running at the remote end and the machine is reachable, the data from the new host will appear under the other hosts label in the choice tree. All hosts opened this way will be remembered in future Habitat sessions and included in the tree, although won't be opened until the option is selected. File->Close can be used to forget about a machine or click right on the label and choose Close.
Files containing data can be opened using the menu option File->Open... and the resulting filename appears under the my files label if the format is valid. Native Habitat files (ending .rs), CSV or text files can be opened with other formats coming soon. By convention, each file represents a single machine and is named by the system name. Habitat on the host named 'apollo' generates a file called apollo.rs and has the label apollo in the tree. Files can be historic or live, allowing a past performance run and the current state to be examined with the same tools. Remote files may be mounted by NFS or SMB, although this may not give the most accurate information due to the caching carried out by datastores not based on disk. It is likely to be accurate to within one minute or so. Consequently, it is preferable to connect using other hosts.
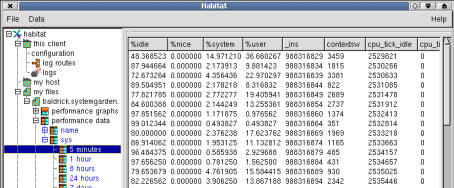
Opening a machine node in any of the above methods will show the visualisations possible using the data found in that file or on that machine. We have looked at performance graphs in the section above; instead click on performance data, then a probe such as sys and finally a time period. This generates a tabular view of the collected statistics from the sys probe in the visualisation pane on the right.
The rows represent samples, and columns represent attributes, such as CPU idle figures, the number of context switches, etc. As with the graphs, the column labels are short for brevity but hovering over the text with a mouse reveals explanations for each statistic. Double-clicking on a row creates a new pop-up window and displays the rows in a column for clarity.
Clockwork, the Agent
Data is collected by Habitat's backend agent, called clockwork, which is started by the MyHabitat graphical tool. You are asked whether you want the agent to run when the tool is first started, and normally continues running until the system is restarted or the agent is stopped via the tool. The agent repeatedly samples and stores data on local disk, a process which is described in greater detail later in this document.
As clockwork is just a background daemon using the command line, it can be distributed to a large number of systems in bulk and run from rc?.d using the supplied init script. In fact the RPM package of Habitat will normally arrange for clockwork to be run on system startup as part of its installation. Other Habitat instances will pick up collected data when attached as a peer. The agent can be started and stopped independently of the graphical tool.
'Agentless' collection is also possible in the System Garden family using Hunter, although this is not part of the Habitat package. Hunter would be used to keep minimise administration work and be applicable to larger installations.
Harvest Respository and Analysis
Data collected by Habitat can also be sent to a central repsitory, storing all data or a subset from every server. There are many reasons why this should be done
- Long term storage for all machines, not just the most recent
- Aggregated views of the estate
- Long term performance trending
- Data available to non administrators
- Cantral analysis of estate data
- Offloading query traffic from application to infrastructure machine
- Centralised configuration
- Support scalability in larger installations
The repository that System Garden offers is Harvest, which is an additional product to Habiat and offers a web interface to analysists, managers, programmers and support staff. Harvest analyses contributed data to make an enterprise's estate more efficient. See https://www.systemgarden.com/harvest.html for more information.
Habitat sends data to the reposiory periodically using a sample sequence mechanism, in a process known as replication. This allows irregular synchronisation without losing samples. Update frequences can be tuned to be very frequent or just once a day, the default. It can even be triggered manually by a command line tool.
Data traffic is two way, and Habitat can read and display all data stored centrally via another tree label: repository. Once a repository is configured, MyHabitat automatically connects on start up and makes all hosts avilable using a hierachical organisational structure, which is provided by Harvest. Under each host label is the data that has been stored by that host and can be viewed as a graph or table like all other data. Repositories can also exist over the internet, allowing Harvest to operate as a 'Software as a Service' or even over a firewalled connection.
Monitoring and Events
Habitat has the ability to monitor files for pieces of text and when detected cause an alert or management action to be raised, such as an e-mail notification or paging request. For example, it is possible to search a set of files for the phrase `late feed arrival' and send e-mails or pager messages to support staff, letting them know that unattended processing is not going to plan.
Not only can files be monitored, but the habitat route system ensures that all valid datastores, files and URLs also have the ability to act as sources, leading to much greater flexibility. Routes are a type of superset url provided by the habitat infrastructure, extended to encompass different types of protocols and habitat storage methods.
All monitoring in Habitat is carried out by looking for pieces of text known as patterns and may contain an extensive set of wild cards, known as regular expressions. This provdes an extremely flexible mechanism for finding problems.
The actual work of monitoring is carried out by the clockwork agent and can be viewed from the MyHabitat tool under the node pattern watching in the choice tree.
Pattern matching work is carried out in jobs executed within clockwork and tie a list of files to a list of pattern-actions with a certain frequency. This gives a large amount of flexibility: for example, different applications could have different jobs. It would then be up to each application support group to define the frequency, sources and patterns independently of peer groups.
The table below explains the choices available to MyHabitat.
| watching jobs | These are the jobs in clockwork that carry out the file watching activity. Each job specifies a source list, a pattern-action list and the period at which checking should be repeated. |
| events | Each time a match takes place, the event is logged to a route. This choice will display the event log against the time that it took place and the action that was carried out. Typically, the log is configured to keep only the most recent events, which limits excessive space usage. Fortunately the number of events saved may be altered to increase the history for verbose logging sources. |
| pattern-actions | Multiple named tables that define what to look for and what to
do with it. The patterns use regular expressions
as described above and each complete line from the sources
is checked for its occurrence.
Actions use methods just like the probe mechanism
in clockwork. Each pattern that is detected will cause
the method to be run and be passed a descriptive string on
its command line. An example might be the sh method
running a paging program or a relay method forwarding
the string to a route which sends an e-mail or IRC.
Also defined for each pattern are embargo times and counts, which restrict the number of events raised. After the first event, the successive matches are counted and timed. If a time has been set, no further events are raised until that time has expired, when one more will be raised and the timing process starts again. A count parameter works in a similar way to time, but checks for a minimum number of matches before raising an event. Counts and times may be combined, in which case the results for each are logically OR'ed together to discover if an event should be raised. |
| watched sources | Multiple named lists that contain data sources to monitor in
the route specification. Each time a
watching job runs, every source in the list is checked for
size changes since it was last read. If a file shrinks in size
then it is assumed that the file contents are new and unchecked
(probably as a result of a log roll);
the checking starts from the beginning (file location 0).
If the route is one of habitat's datastores (such as timestore) then it is ring based and checking starts from the last sequence in the ring. |
By default, configuration data should be placed in the same datastore file as the clockwork job that requires it. The tables could be placed anywhere, however, and may help in delegating the control of pattern matching to individual application groups.
Route Recording
Like pattern watching above, route recording scans a list of routes (files or datastores) for changes. However, instead of looking for patterns, the whole file is copied whenever a change takes place.
This enables the state of certain system or application files, that have no version control mechanism of their own, to be captured over time.
The configuration is simpler than that of pattern watching; only a single table is needed. The full description of the views available are held below.
| recording jobs | These are the jobs in clockwork that carry out the recording activity. Each job specifies a source list and the period at which checking should be repeated. The checking interval would normally be much longer than for pattern watching, say every five minutes. |
| changes | Each time a change takes place, it is logged against time and a notification is placed here. The full files can be stored in a versionstore or another type of ring, such that only the most recent is kept. This limits the amount of storage that would be used and is up to administrative control. |
| recorded sources | Multiple named lists that contain data sources to record in the route specification. Each time a watching job uses the list, every source is checked for a change in its time stamp and size since it was last scanned. If the source has changed, it is recorded. |
Configuration
Habitat's configuration is no less flexible, allowing standalone use or multilevel configuration for large or small groups. Customisation is possible at a user, system, regional or global level. When Harvest starts, it can poll each level and superimpose them into a complete configuration picture. The resulting values can be seen under the choice label this client and the settings are used in clockwork, ghabiat and all the other command line tools.
Clockwork is a task driven agent: everything it does beyond communications is defined by a set of tasks held in a job table. Each probing activity or data conversion is defined as a job, running at a defined period and using the route system to manage the stream of data between the activities. The table can be seen under the choice node jobs with each job occupying one line. Habitat runs out of the box with a standard job table, writing to a single data store.
The location of job table is defined by the configuration. It can be held in the datastore to be upgraded by replication, as a data file alongside the application or as a URL from a central server. Standard deployment packages options are avilable from System Garden to suit many scenarios. The package contains job and configuration tables.
The replication of locally collected data to the central repository is carried out by a single job that triggers the internal replication method. The arguments to the job dictate which data are sent to the repository and which ones are to be collected.
Data stores
Habitat is able to use many different data and time series formats, as it converts everything to a common internal model. The current native format is called a ringstore and files created are labelled with a .rs extension. Each store can hold multiple time series in a structure known as a ring and each ring can hold many single or multi-instance metrics.
Conventionally, the data from a machine is held in a single ringstore file, with different types of data held in separate rings. General system data is held in a ring called sys, networking in net and so on. When viewed in MyHabitat, the time series tables are concatenated together to form a single viewing table, ordered by time.
Further Reading
This document has walked you thought various aspects of habitat and hopefully has shown the reader some of the facilities available.
It is not possible to cover everything, however, and there is much more detail to go over. This can be found in other white papers and in various manuals, such as the programming and system manuals.
Good luck!