
Habitat 2.0 Alpha User Manual
Contents
- Introduction
- Data Sources
- Displaying Data
- Customisation and Preferences
- The Collection Agent: Clockwork
- Command Line Utilities
- Data Formats
- Upload, Download and Replication
with System Garden
Manual Pages
Introduction
Habitat is an extensible collector, monitor and viewer for system and application time series data. It connects to System Garden for social IT management and acts as a data gateway to upload and view streams of time series data from your organisation.
Historic data is central to the workings of habitat, with all collected information being sent to the local light weight data store and thence to the optional System Garden archive for long term storage.
A large number of measurements are taken from the system by default, including disk storage, processor utilisation and network usage. All the metrics can be examined over arbitrary time to gain a full perspective of the work the machine has done. By reducing the samples of data over time (a process called cascading), habitat is also able to give long term trends from only local data whilst keeping modest storage requirements.
The graphical application provided by Habitat is called MyHabitat and once data has been collected for a little while, you would expect to see a display like the one below.
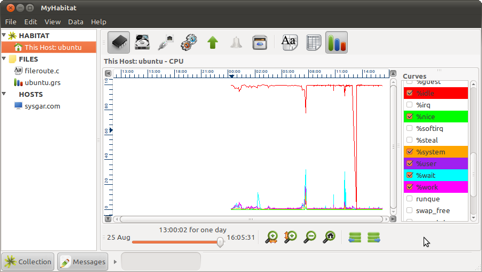
MyHabitat showing the local machine source, two files and a remote host; the data drawn is from the local machine
MyHabitat has a split view with data sources on the left and the selected data on the right, similar to an 'explorer' type interface.
Each source is typically a server, service or grouping of servers and services: the local host is at the top of the choice list. When selected, a default data view is shown to the right, with buttons along the top to change the data seen and how it is visualised. The buttons below help navigate and alter the appearance of the tool.
The slider at the bottom shows how much data has been loaded and can be displayed; move it to the left to load and display more data. Zooming into the chart does not affect this control.
How to Start
Just run the command myhabitat inside the bin directory or launch from the Application menu, which will start the graphical tool containing a splash screen and invite you to start the collection agent.
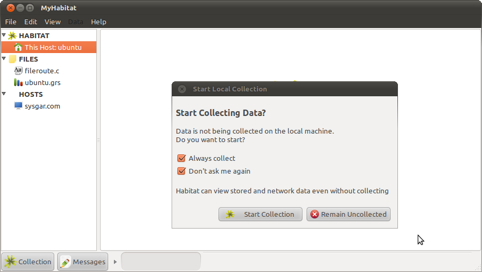
Click on Start Collection and after a while data will load in a graph format
In the current release, the default data collection rate is every 60 seconds (which can be customised) and will store this information to disk. Therefore, you will need to wait for two to three minutes for meaningful data to appear.
To start the collection daemon only with out starting the graphical application, just run clockwork from the bin directory. See the manual page clockwork(8), the Collection Agent section later in this manual and lastly the Habitat Administration Manual for more information about the collection agent.