
Habitat 2.0 Alpha User Manual
Contents
- Introduction
- Data Sources
- Displaying Data
- Customisation and Preferences
- The Collection Agent: Clockwork
- Command Line Utilities
- Data Formats
- Upload, Download and Replication
with System Garden
Manual Pages
Displaying Data
Selecting Rings
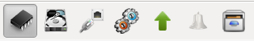
CPU Storage Network Processes Uptime Events Other
Habitat can collect and store practically any time series tabular data. Out of the box, the following are collected and buttons for each are shown in the top viewing row in MyHabitat.
|
CPU |
System and processor statistics |
|
Storage |
Capacity and performance of storage |
|
Network |
Networking statistics |
|
Processes |
Process table over time (potentially filtered) |
|
Uptime |
How long the machine has been running |
|
Events |
Local detection of patterns found or data thresholds crossed |
|
Other |
Menu of all the other time series data. In habitat jargon, these are also called 'rings' (as they are ring buffers) |
If the ring is present in the source data, the corresponding button will be illuminated. If missing, than the button is deactivated. Sources that have no rings, for example CSV files, will not activate any buttons.
Data sets or rings of data that do not correspond to the standard set can be selected by clocking on the ‘Other’ icon (the filing cabinet draw) and choosing the item from its pull-down menu.
Each ring holds many attributes, such as processor utilisation (%cpu or %work) and these can be seen in a table or selected in a chart.
See the manual pages habget(1), habput(1) for command line extraction and import of data.
Choosing Views
D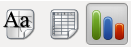 ata
can be viewed in three ways: chart, table and plain text, each of
which is represented by buttons in the right hand pane. Providing
that buttons are active and illuminated, then you can switch the view
of the data between each visualisation.
ata
can be viewed in three ways: chart, table and plain text, each of
which is represented by buttons in the right hand pane. Providing
that buttons are active and illuminated, then you can switch the view
of the data between each visualisation.
During the display process and from the hints when the data source is loaded, MyHabitat attempts to check the format of the data to see if can be structured into a table. If it can, then the appropriate buttons are activated.
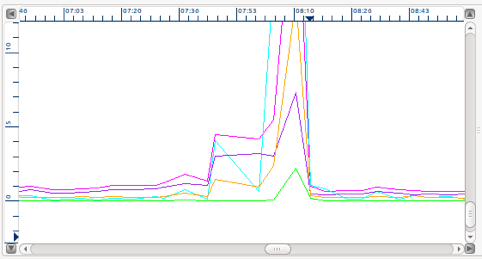
Using Charts
When a chart view is selected, the right hand pane is altered to a display similar to the one below. A multi-curve chart with scroll bars to pan, date stamps on the horizontal axis, values on the vertical axis and coloured list of curves on the right
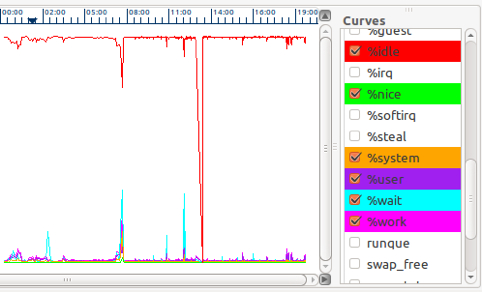
The curves and the corresponding list entires share the same colour. Clicking on a curve’s tick box will draw or remove the curve in the chart. MyHabitat has a list of default curves to select when a new data set is plotted and this can be customsed.
Loading Historic Data
MyHabitat loads and caches a small amount of data initially to minimise the system load and keep the timings short. Typically this is up to one day, although this can be altered using Edit->Preferences from the menu bar.
The amount of loaded data can be increased by using the time slider at the bottom of the right hand pane. The slider shows the limits of available data from the source: in the example below, it starts on the 25th August, 13:00 today is the first data shown in the chart and ends at 20:28.
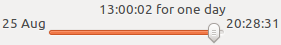
Moving the slider to the left fetches the missing data and replots the chart, caching locally to increase performance.
Zooming and Panning Data
As Habitat is able to show a lot of data in a single view, it is common to zoom in to particular times to see the detail more clearly.

Using the zoom buttons allows the chart to be increased horizontally to expand the time scale, vertically to expand the value domain or both. To return to normal, there is a zoom out function and a ‘home’ function to rest the view to normal.

A second way to zoom, especially useful to see small areas is to drag a box over the area of interest with the left mouse button. Release the button when drawn and click inside to enlarge the horizontal and vertical areas.
Once zoomed, move around the chart by using the scroll bars.